Radiology
Breast MRI Findings: Kinetics
by Michael Roubakha, MD, Fadi Dahoud, and Cheryce Fischer, MD
- Refers to breast lesion enhancement curves, also known as Kuhl enhancement curves
- In addition to the margins of a lesion, the enhancement intensity of a lesion on MRI two minutes or less after contrast administration is the most important feature for lesion diagnosis
- The next most important feature is the qualitative assessment of the enhancement curve1
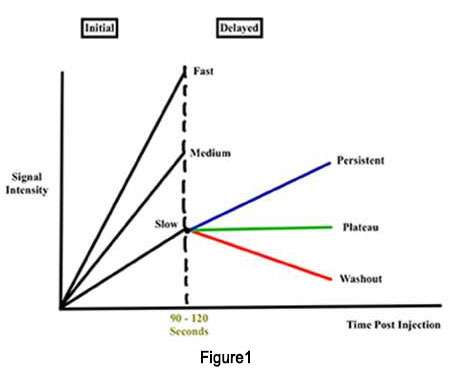
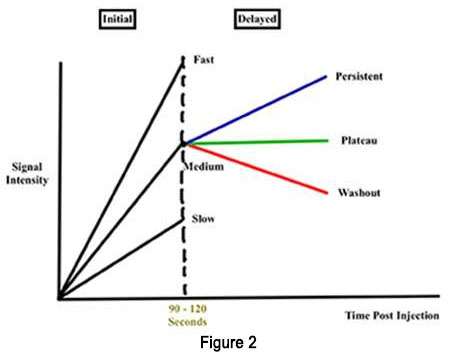
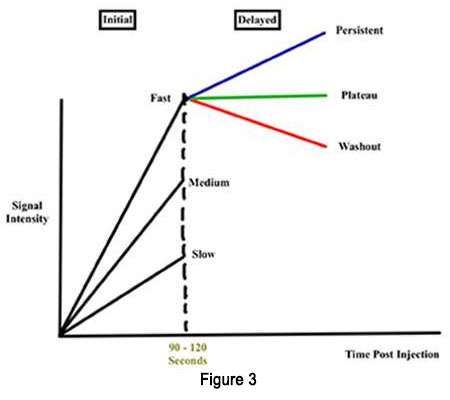
There are three possible initial phase curves (in order of least to most concerning):
- Slow
- Medium
- Rapid
There are also three possible late phase curves (in order of least to most concerning):

Type I: Progressive Pattern (Figure 1)
- Continued increase in signal intensity over time
- Usually a benign pattern (83% of lesions)
- Only about 9% of lesions are malignant2
- Sensitivity of 52.2% and specificity of 71%3

Type II: Plateau Pattern (Figure 2)
- Initial uptake followed by leveling off of signal intensity
- Suggestive of malignancy (sensitivity of 42.6% and specificity of 75% for malignancy)3

Type III: Washout Pattern (Figure 3)
- Initial uptake followed by reduced enhancement
- Strongly suggestive of malignancy (specificity of 90.4% and sensitivity of 20.5%)3
Finally, a lack of enhancement does not completely exclude in situ or invasive cancer.
References
- Macura KJ, Ouwerkerk R, Jacobs MA, Bluemke DA. "Patterns of Enhancement on Breast MR Images: Interpretation and Imaging Pitfalls." RadioGraphics 2006;26(6):1719-1734. DOI:10.1148/rg.266065025
- Kuhl CK, Mielcareck P, Klaschik S, et al. "Dynamic breast MR imaging: are signal intensity time course data useful for differential diagnosis of enhancing lesions?" Radiology 1999;211:101–110. DOI: 10.1148/radiology.211.1.r99ap38101
- Bluemke DA, Gatsonis CA, Chen MH, et al. "Magnetic resonance imaging of the breast prior to biopsy." JAMA 2004;292:2735–2742. DOI: 10.1001/jama.292.22.2735